About This Project
The fight against climate change is proving to be a formidable challenge but the youngest generation are a rising force for climate justice. Lead by inspirational peers such as Swedish teenager Greta Thunberg, young people all around the world are pushing governments and international corporations to take responsibility for their CO2 emissions, and act to reduce them.
The greatest step we can take towards combatting climate change is the conversion to clean, renewable energy resources such as wind and solar. When we burn fossil fuels, such as coal and oil, greenhouse gases (like carbon dioxide) are released which harm our environment in many ways. These gases linger in the Earth’s atmosphere, acting as a blanket, gradually warming the planet. The more greenhouse gases in our atmosphere, the thicker the blanket becomes.
As scientific researchers at the University of Cambridge (www.stranks.oe.phy.cam.ac.uk) one of our jobs is to discover and develop novel materials that will help provide green energy for future generations, with a focus on producing low-cost solar cell materials. We also have a responsibility to share our research and expertise with others in order to accelerate the uptake of green energy sources and spread awareness of the issues faced by society.
The Primary School Energy Mapping Challenge is one such way to reach out and share the knowledge we have gained from our studies and experiments. With this project we aim to teach budding young scientists at Primary Schools across the UK, about the benefits of renewable energy and its potential to permanently replace fossil fuels.
In this programme, we are asking students to measure the sunlight and wind-speed in their school yards, each day, for a six-week period. By providing measurement instruments and demonstrations we will facilitate development of their investigative skills and scientific mindedness. Pupils will log their data on this online portal which not only describes and contextualises the amount of energy that could be generated by a small wind turbine or solar installation on their school grounds but allows them to compare data with other schools around the country.
This project hopes to give awareness to the youth that will be affected by the climate crisis, while also teaching them important critical thinking and data acquisition skills that are appropriate for this age group (Year 6, Primary 7). Equipped with wind and solar measurement tools, the students will take complete ownership of the project. Throughout, they will be exposed to concepts such as energy, power, electricity, and scientific units.
We are thrilled with the energy and enthusiasm shown by the students so far and hope to keep this project growing across the UK. If your Primary School is interested in joining in on this unique challenge, please do not hesitate to contact us!

|
|
| Dr Beth Tennyson (et446@cam.ac.uk) | Stuart Macpherson (sm2275@cam.ac.uk) |
The Experiments
Generating electricity from sunlight
Sunlight is the most abundant resource on earth. We receive LOTS of light energy from the sun!
The amount of sunlight shining on the earth contains more than enough energy to power the entire world. However, right now in 2019, we don’t have enough solar panels to collect this energy. In fact, we need to build 50 times more solar panels than we currently have, to satisfy our power-hungry planet (take a look at figure 1 to explore this in more detail).
While improving our solar panels and building more of them are excellent ways to collect more renewable energy, we need to think carefully about where to place these panels. Some parts of the world receive less sunlight than others. For example, India receives around twice as much sunlight per area of land, as Ireland. This is part of the reason that India has chosen to build 1000 times more solar panels than Ireland!
Even in the UK, the amount of sunlight hitting the ground can vary strongly from place to place. But by how much? Would it make sense to attach solar panels to the roof of every school in the UK? Or would it be more sensible to collect other types of renewable energy in some regions?
To answer these intriguing questions, we need the help of a clever, diverse and enthusiastic team of young scientists from across the country…
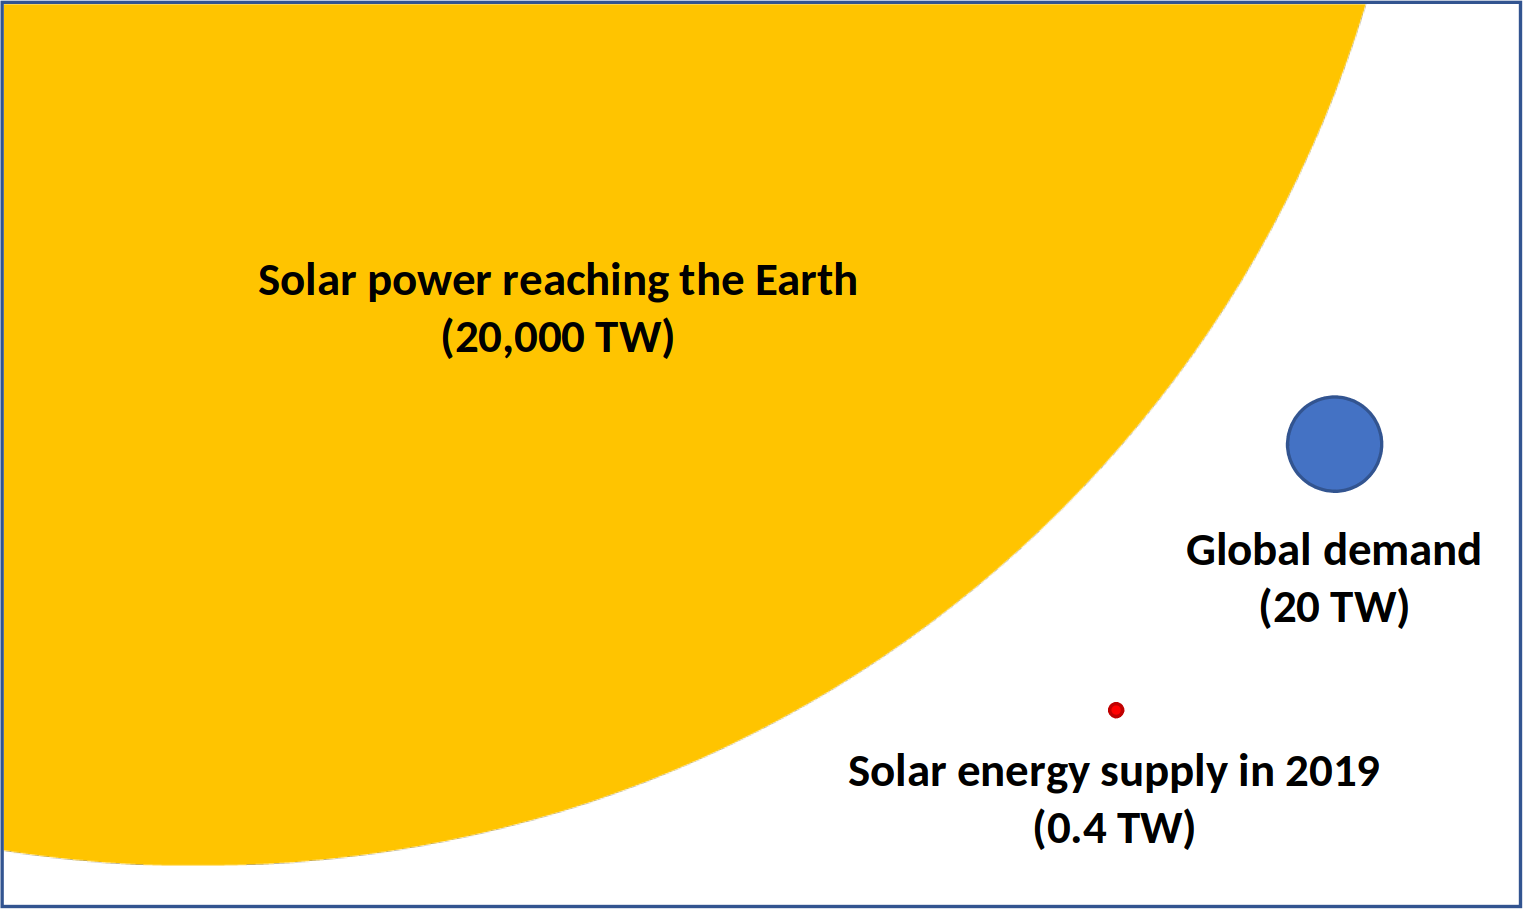
Figure 1: Solar energy and global demand
The sun shines around 20,000 TW (Terawatts) of power on the Earth. That is 20,000,000,000,000,000 Watts (20 quadrillion!). Of the 20 TW we need to power every country on earth, a total of 0.4 TW is currently generated by solar panels (~2% of all electricity).
Scientific measurements
We are asking our student scientists to measure sunlight and wind speed in their school playground, every day for 8 weeks. By doing this, they can build up a picture of how much solar energy or wind energy could be collected if solar panels or a wind turbine were installed at their school. They can then compare their data with that of the other participating classes, to figure out where in the UK is best to invest in solar or wind energy.
To measure how much light energy the schools are receiving from the sun, students will collect data with Luxmeters. These tools measure the amount of visible light incident on a sensor (see figure 2 to find out more about visible light). The amount of light is then displayed on the screen, in Lux.
Solar panels collect light energy from the sun and convert this into electrical energy that we can use. The more light that is absorbed, the more electricity we can gather. We can either use this electricity to power our homes and devices, or we can store it in batteries to use later.
After crunching the numbers, we can figure out how much power our solar panels can generate with the sunlight (Lux) measured that day. The power output of the solar panel is measured in Watts. The students will investigate how much power their solar panels would produce each day and compare this amount of power with real world applications, e.g. how many electric cars could be charged for the “school run”, with power from the sun?
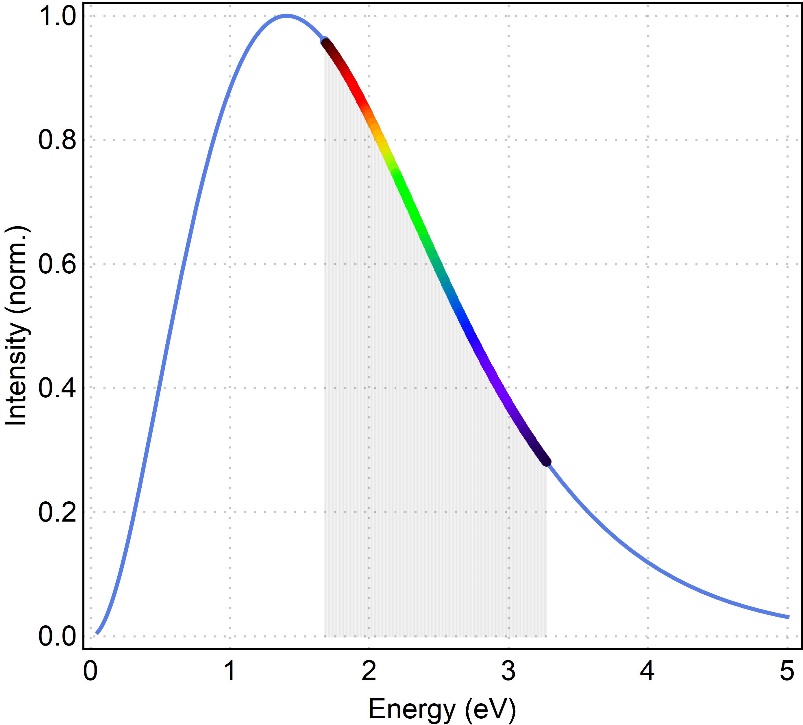
Figure 2: Graph of the solar spectrum
The sun emits many different types of radiation. The two main types of radiation it emits are infrared (which our bodies can absorb and feel as heat) and visible (which our eyes can detect). Every colour of the rainbow is emitted by the sun, from low energy red light, all the way to high energy violet light.
Beware of ultra-violet light - this has more energy than infrared and visible light and can damage eyes and skin. Sun cream and sunglasses can block ultra-violet light, keeping us safe.
To determine how much wind energy the schools can collect, the students will use anemometers to measure the wind speed in metres per second. Wind turbines generate electricity when the movement of air makes their blades move, rotating the turbine. The faster the air moves, the faster the turbine will spin. So, on a windy day when the wind speed is higher, we can generate more electricity.
After crunching the numbers, we can figure out how much power our wind turbine can generate at a certain wind speed. We have specially picked solar and wind installations that should produce comparable amounts of power in UK weather conditions. It will be informative for students to compare their wind and solar data to decide which renewable energy type is best for their school.
Big questions…
Weather in the UK is extremely changeable and day-to-day forecasts vary dramatically. Weather conditions will also vary more steadily, on a seasonal basis. Ideally, we want students to be able to identify these effects from their data and rationalise the answers to such questions as, “Why do we generate more solar energy in summer?” and, “Why do wind turbines and solar panels work well together?”.
Figure 3 shows how the UK already uses a diverse renewable energy supply to cope with varying power demand.
Figure 3: Chart showing monthly electricity demand in England & Wales (black line) and the monthly electricity supply from renewable sources such as wind (black bars) and solar (white bars).
While wind power drops in the summer months, the energy deficit that is created is almost entirely offset by the increase in power from solar such that the supply matches the varying demand. (Source: https://publications.parliament.uk/pa/ld200304/ldselect/ldsctech/126/4021102.html)
And the biggest question: Are renewables worth investigating and investing in?
… Definitely!
Crunching numbers
This section is intended for the interested or intrigued who would like to explore every step that is taken to calculate the energy statistics from the student’s data.
Students are measuring sunlight (Lux) and wind speed (m/s) but we want to show them how much useful energy can be harnessed using solar panels and a wind turbine, according to these values. To that end, we must make some assumptions about the technology that could realistically exist on the school premises, and that may conceivably be incorporated into new-build schools of the future.
Hypothetical solar installation:
- 16% efficient solar panels (this is conservative but realistic for competitively priced modules).
- Area coverage of (5x5) m2 = 25 m2.
- Luminous efficacy of sunlight = 92.5 Lumens/Watt (see figure 1)
- Average hours of sunlight = 0.5 x H, where H is the number of daylight hours at the latitude of each school on a particular day of the year (see figure 2 and figure 3).
Hypothetical wind installation:
- Windspot 7.5 kW turbine (Height = 15 m, Blade diameter = 6.3 m).
- Students are measuring wind speed at a height of 1 m above the ground.
- Regular “cut in” speed for this turbine is 3 m/s but to avoid “zero power” days we have set the power output below this wind speed, to a small non-zero value (see calibration curve in Figure 4(b)).
- “Cut out” wind speed is 20 m/s (too dangerous to operate).
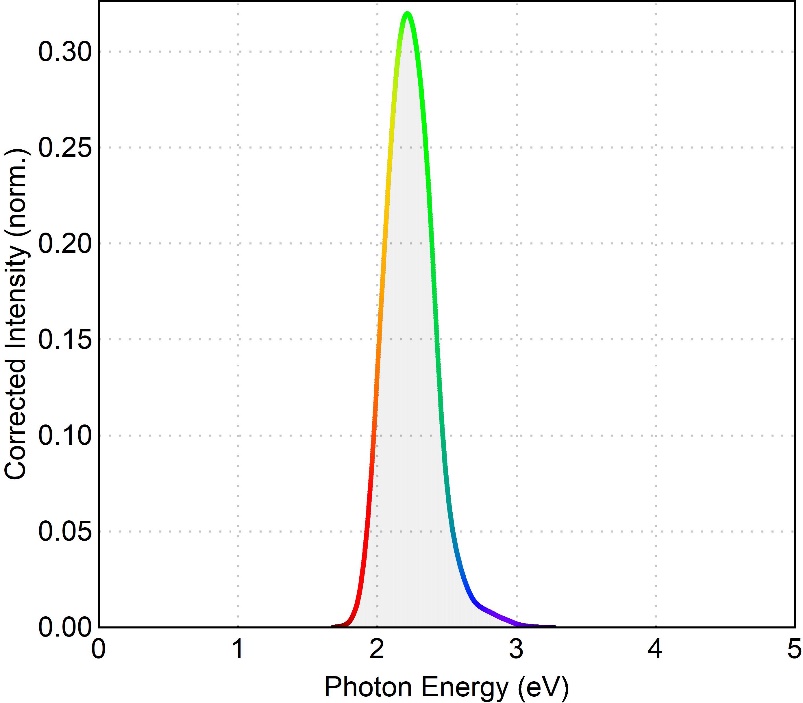
Figure 1: Sunlight, as measured by a Luxmeter
Our Luxmeters are only sensitive to visible light, so this is what the sun looks like to them – no infrared or ultra-violet light is detected. Interestingly, this is also what the sun looks like to our eyes (Photopic spectrum)!
By integrating the product of the solar and photopic spectra we can calculate a parameter called the luminous efficacy. This is the relationship between the intensity of the visible light (Lux) emitted by a source, and the power of the source (Watts).
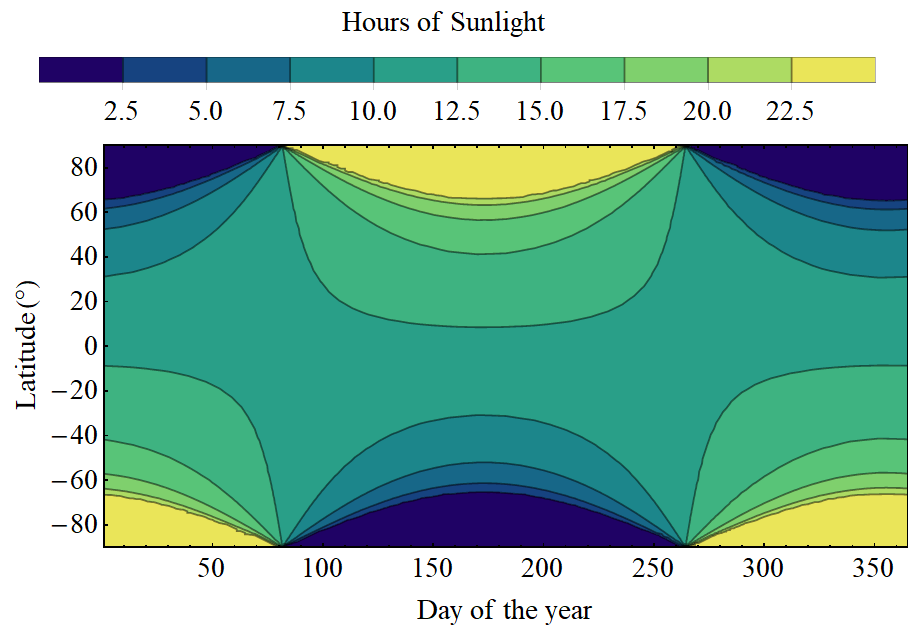
Figure 2: Daylight hours by latitude
The tilt of the earth relative to its rotational and orbital axes mean that the number of hours of daylight changes throughout the year, depending on the latitude of a place (how far it lies from the equator). In January, it is winter in the northern hemisphere so days there are at their shortest. It is summer in the southern hemisphere.
At the spring and autumn equinoxes (around days 80 and 260), the earth is tilted neither towards or away from the sun, so the length of the day is the same (12 hours) all across the globe!
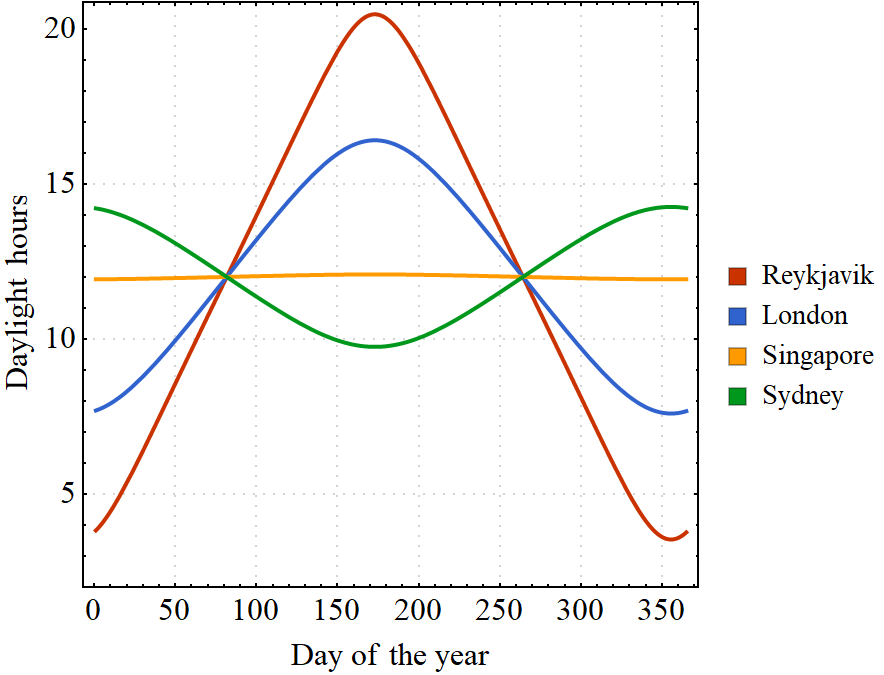
Figure 3: Daylight hours in different locations
In the UK, days are longer in the months of June & July because the northern hemisphere is tilted towards the sun. The opposite is true for places in the southern hemisphere, like Australia.
The variation is most extreme in places which lie far from the equator, like in Iceland where there is almost no daylight in winter. Singapore on the other hand, lies very close to the equator so the length of day there barely changes.
Wind turbines are built to be tall because wind speed increases with altitude. The wind turbine we have chosen as a model for this project is the Windspot 7.5 kW turbine which is 15 m tall. Since our students will be taking wind measurements at their height above ground level (~1 m), we must apply a correction factor to their data to estimate the wind speed 14 m above.
By assuming the wind speed at low altitude obeys the logarithmic wind profile, figure 4(a) shows the predicted wind speed at increasing height when the wind speed at 1 m is 1 m/s. Curves are shown for 3 different levels of terrain “roughness”.This quantifies the height of any obstacles on the ground which introduce drag, reducing the measured wind speed. Assuming an open area of a school playground to have a low roughness level of 10 cm, we can calculate the wind speed at the height of the turbine to be 2.2x higher than at 1 m. Figure 4(b) shows the calibration curve of our wind turbine of choice which allows us to determine its hypothetical power output from the corrected wind speed at 15 m.
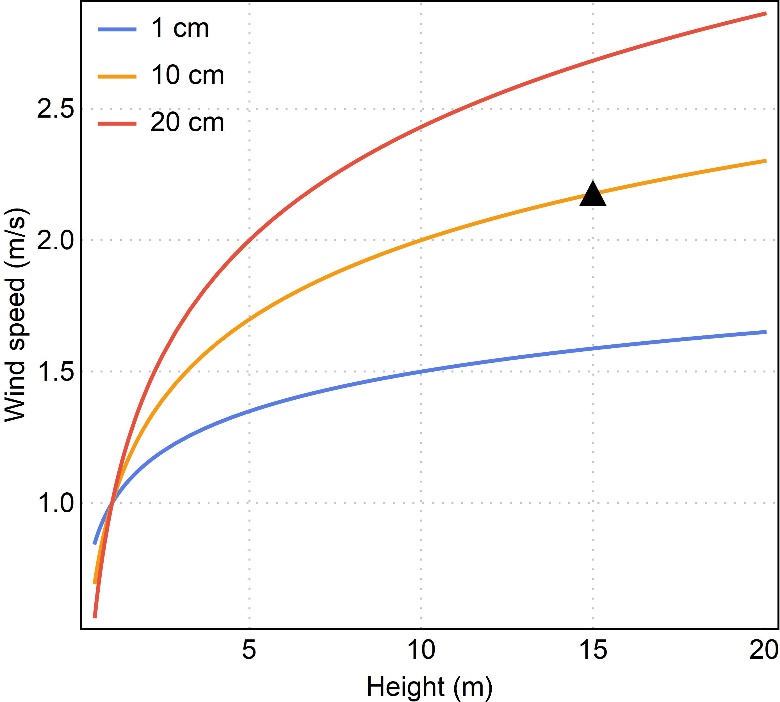
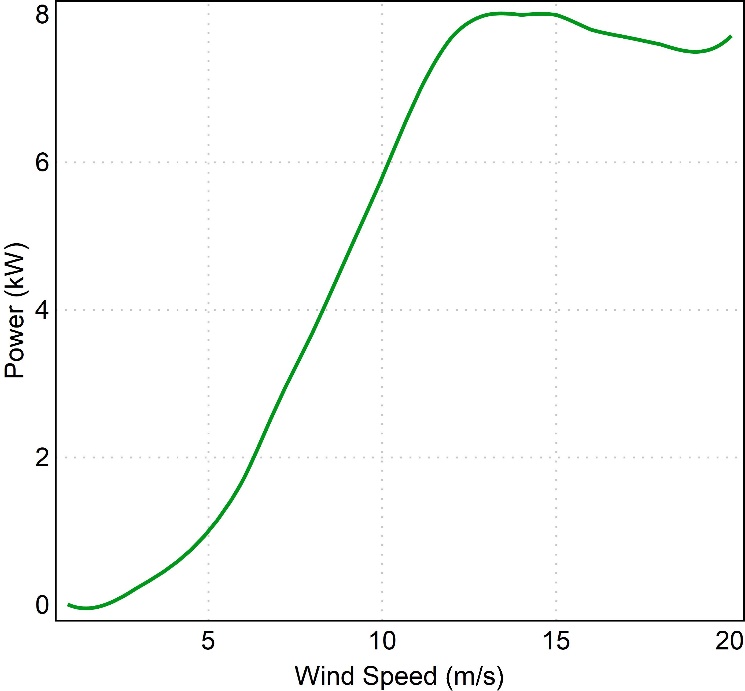
Figure 4: Calculating the power output of a wind turbine
(a) Estimating the wind speed at increasing altitude, from the speed at 1 m above ground when the ground roughness is 1 cm (blue), 10 cm (yellow) and 20 cm (red).
(b) Power calibration curve for the Windspot 7.5 kW turbine. This curve is measured by the manufacturer and tells us the expected power output of the turbine at different wind speeds.
Unit Conversions
Scientific units are what we use to quantify measurements. It is important to use units when describing how much of something there is, so that other people can understand what you are quantifying.
For example, if Anna wants to tell Bob how long it takes to walk to the shop, she might describe the duration of the walk in units of minutes or seconds. If Bob is familiar with minutes and seconds, then he knows exactly how long the journey is going to take him. As we know, 10 minutes is very different than 10 seconds!
Choosing appropriate/sensible units is also important. If Bob wants to know the distance to the shop, it might be helpful to describe it in metres or kilometres. However, imagine Anna tells Bob the distance in elephants. Unless Bob knows the length of an elephant, this is less helpful!
The size of the unit is also important to consider. A light bulb in your house might use 10 watts of power. Now, the wind turbine that we are using in our model generates up to 7,500 watts of power, and whole wind farms may generate hundreds of times this number! To avoid having to use numbers that are clumsily large or small we can define new units like the kilowatt which is equal to 1000 watts. Therefore, if our wind turbine generates 7,500 watts, this is equal to 7.5 kilowatts, which is much clearer and easier to write.
Use the interactive tool below to find out how different units can affect the calculations we make. We calculate the amount of energy used by an appliance by multiplying the power it requires, by the time it is used. This also works for devices which generate power like solar panels and wind turbines.
Try calculating how much energy a 10 watt lightbulb uses if it is powered on for 60 seconds!
How much energy can we generate if our wind turbine is creating 5,000 watts of electrical power for 2 hours?
Other Useful Resources
- https://www.stranks.oe.phy.cam.ac.uk/ The website for the group behind this project!
- https://www.pveducation.org/ A thorough collection of lessons about all aspects of photovoltaics and solar cell engineering.
- https://www.withouthotair.com/ An excellent book by David J. C. Mackay; a sustainable energy bible.
- https://www.explainthatstuff.com/solarcells.html
- https://codeshare.phy.cam.ac.uk/itservices.phy/adopted/energy-map The code that runs this website, you can see how it works.